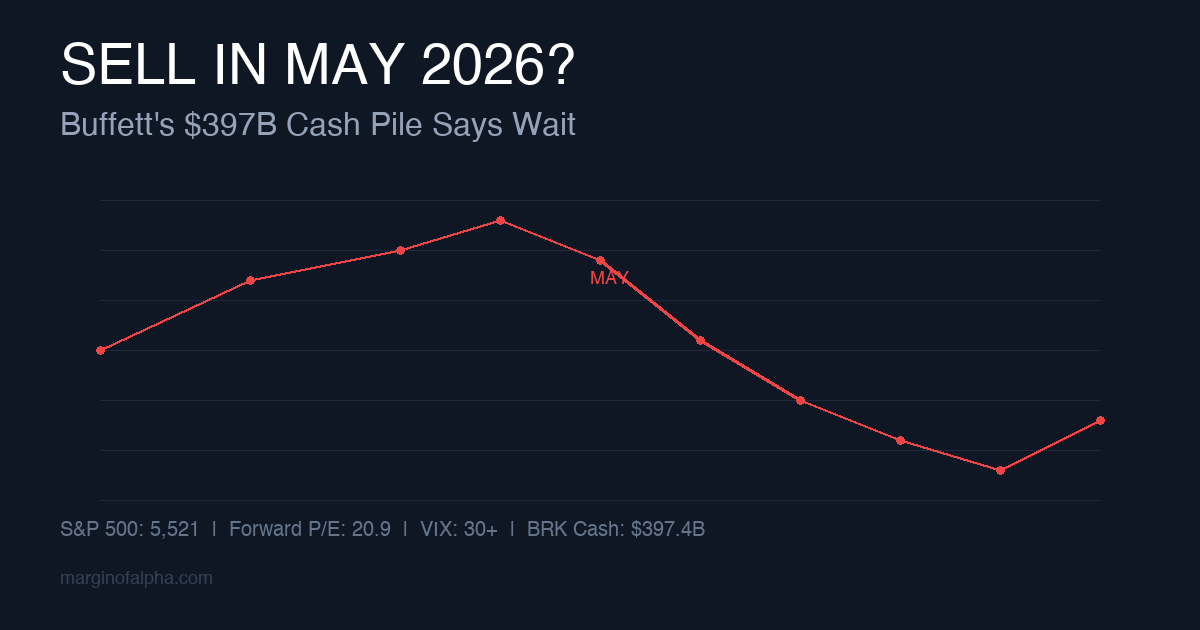
Berkshire Hathaway just reported a record $397.4 billion in cash. The S&P 500 sits at 5,521, trading at a forward P/E of 20.9 — 28% above its 25-year average. And Warren Buffett called the current market a “casino.”
We’re entering the weakest six-month stretch of the four-year presidential cycle. Here’s what the data says, what Buffett is signaling, and what to actually do with your portfolio.
Why 2026 Is the Year “Sell in May” Matters
The old adage gets mocked every year by buy-and-hold purists. Most years, they’re right. But there’s one exception: midterm election years.
Mark Hulbert at MarketWatch has tracked the “Halloween Indicator” for decades. His finding: the sell-in-May pattern is statistically significant during exactly one year of the presidential cycle — the midterm year. That’s 2026.
The numbers back it up. Data going back to 1949 shows the S&P 500 delivers its worst returns between May and October of midterm years. The Dow Jones Industrial Average has historically bottomed in midterm years, then rallied an average of 46.3% from that low to the pre-election year peak, per the Stock Trader’s Almanac.
The S&P 500 Seasonality Problem
Since 1950, the S&P 500’s average monthly returns during midterm years tell the story: May through September are net negative or flat. The worst stretch typically hits between August and October.
Ameriprise Financial’s analysis of midterm elections from 1945 to present confirms the pattern. The S&P 500 delivers below-average returns for most of a midterm year, then recovers sharply once election results hit in November. Political uncertainty presses on prices for months, then vanishes.
This isn’t fortune-telling. It’s a statistical tendency built on 80 years of data across 20 midterm cycles. No guarantees for 2026 specifically, but it sets the base rate.
Buffett’s $397 Billion Signal
The greatest investor alive is sitting on the biggest cash pile in corporate history.
Berkshire Hathaway’s Q1 2026 earnings, reported May 2, showed cash and equivalents at $397.4 billion — up $24 billion in one quarter from $373 billion at year-end 2025. The company is still net selling stocks.
Buffett, now chairman after handing CEO duties to Greg Abel in January, didn’t mince words. Asked why Berkshire wasn’t deploying capital despite 2026’s volatility, he called the market a “casino.” Prices aren’t attractive enough yet.
Think about that. The company that built its reputation on buying when others are fearful is telling you — with its balance sheet — that fear hasn’t reached productive levels.
Berkshire has never held this much cash. Not in 2000. Not in 2008. Not in 2020. Three years of building cash while the market rallied. Being early and being wrong look identical until the correction arrives.
The Valuation Math
The S&P 500 trades at a forward 12-month P/E of 20.9 against a 25-year average of 16.3. That 28% premium comes during a stretch with:
- Geopolitical risk: Iran-US tensions near the Strait of Hormuz, VIX above 30
- Tariff uncertainty: Liberation Day tariff regime still distorting supply chains
- Election uncertainty: Midterm campaigns haven’t heated up yet
- Rate uncertainty: The Fed’s next move is genuinely unclear
Markets can stay expensive for a long time. Buying at 28% above average valuation during the weakest seasonal period, with geopolitical risk elevated and the world’s best investor refusing to deploy? That’s a bad setup for new money.
Three Practical Approaches for May Through October
1. Raise Cash
Sell your weakest positions. Bring cash to 15-25% of your portfolio. You don’t need to liquidate — that’s market timing. But trimming positions that ran since January and waiting for October prices is a strategy backed by eight decades of midterm-cycle data.
This is what Berkshire is doing at scale.
2. Rotate to Defensives
Hulbert’s research found that rotating into defensive sectors during the May-October window in midterm years captures most downside protection while keeping capital working.
Sector ETFs worth a look:
– XLU (Utilities): Low beta, dividend income while you wait
– XLP (Consumer Staples): People buy toothpaste regardless of elections
– XLV (Healthcare): Defensive with demographic tailwinds
3. Build a Watchlist
If you’re not selling, prepare. The midterm year low historically produces some of the best buying opportunities in the entire four-year cycle. That 46.3% average rally from the midterm low is real money.
Build a list of 10-15 stocks you’d want at 15-20% lower prices. Set alerts. When the market corrects — midterm year corrections average 15-19% peak to trough — you’ll have a plan instead of panic.
We track our own ideas in our small-cap stocks coverage, looking for positions with real catalysts. Same principle: know what you want to buy before the sale starts.
The Honest Bear Case
The other side deserves a hearing:
- The pattern has weakened. Central bank intervention has compressed seasonal effects since 2010. The 2022 midterm year saw a brutal October low, but the selloff started in January, not May.
- You might miss the recovery. If the market doesn’t correct, sitting in cash for six months during a rally hurts. Opportunity cost is real.
- Taxes. Selling in a taxable account generates tax bills that can exceed the seasonal benefit.
- Buffett might be wrong. He’s been building cash for three years. The market went up for three of them. Being early is indistinguishable from being wrong until the drop happens.
Where New Money Goes Right Now
Fresh capital? Park it in a high-yield savings account earning 4-5% APY and wait. Short-term Treasury bills yield above 4%. The risk-free rate is genuinely attractive — you’re getting paid to be patient.
Current options worth checking:
– First Foundation Bank Online Savings: 4.50%+ APY
– Vio Bank High Yield Online Savings: 4.03% APY
– SoFi Checking and Savings: Up to 4.00% APY with FDIC insurance up to $2M
Not exciting. But neither is buying the S&P at 21x earnings during a midterm summer when the best stock picker alive refuses to buy.
Keep a shopping list ready. Our small-cap sectors rotation piece identified groups that tend to outperform coming out of midterm corrections. When the VIX spikes above 35 and financial news is all doom, deploy.
If you want to think through how uncertain stretches affect long-term plans, our FIRE in 2026 analysis breaks down why the math of long-term investing hasn’t changed — even if the next six months test your patience.
For investors who prefer to pick individual stocks through corrections rather than sit entirely in cash, our SEC EDGAR filing guide shows you how to spot material events before the crowd.
The Takeaway
2026 is a midterm election year. The S&P 500 is expensive. Buffett is holding $397 billion in cash. The VIX sits above 30. Iran fills the headlines. And the worst six months of the four-year cycle start now.
You don’t need to sell everything. Raising cash, rotating to defensives, or building a shopping list? That’s not fear. That’s discipline.
The biggest gains go to people who have cash when everyone else is panicking. Berkshire’s $397 billion says the panic hasn’t started yet.
This article is for informational purposes only and does not constitute financial advice. Always do your own research and consider consulting with a financial advisor before making investment decisions.